The appearance of chaos
In the examples discussed in the previous paragraphs, regarding the work of Mines and Winfree, we have seen what happens to the heart when abnormal elements, such as damaged tissues or uncontrolled electrical stimuli, intrude in the normal functioning of the organ.
But what can we say about the functioning of the healthy organ, under normal conditions? Was Galileo right to use his own heartbeat as a measuring instrument?
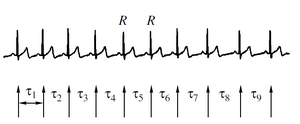
By the late 80s, as the use of computer tools to explore dynamic phenomena increased, many studies have been made to mathematically model electrocardiogram signals. A very interesting fact emerged immediately: the interval between two subsequent beats, the so-called R-R interval, referring to the nomenclature already introduced in the first paragraph and shown in the picture below, is far from constant in a healthy subject .
 Continuous fluctuations in the R-R range from one beat to the other are observed and many scholars have hypothesized that the phenomenon can be treated as a manifestation of deterministic chaos.
What is commonly accepted is that the R-R interval variability is a prerogative of healthy subjects or that, in the presence of heart disorders, a significant reduction in such variability is observed. In general, the variability of a signal can also be studied by means of a Fourier analysis, and in this case a decrease in the signal spectrum is also observed as the age increases.
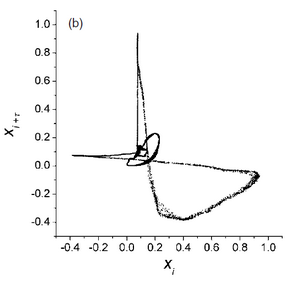
 Starting from a time series that represents the complete acquisition of an electrocardiogram (ECG), the Takens/Mané theorem can be applied to rebuild the system attractor in the phase space.
In the image to the side we see a projection of such a attractor after the noise reduction. To get this attractor it is necessary to use an embedding size of at least 10. The embedding dimension is the size of the space of the reconstructed attractor.
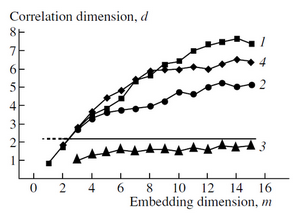
 If, however, we focus exclusively on the values that take the R-R interval during the ECG by replacing the signal with a pulse train, what we get can serve to obtain a pseudo-attractor, which compared to the previous case holds two important information, the size of embedding and the correlation dimension. The correlation dimension is the geometric dimension of the reconstructed attractor. It is noted that this latter value has characteristic values of the type of heart disease.
What we see above is the trend of the correlation dimension depending on the size of embedding for various pathologies. We note that characteristic values are highlighted for: 1) angina pectoris and myocardial infarction; 2) angina pectoris; 3) atrioventricular block; 4) heart failure. The continuous line represents the normal state.
To date there are numerous studies aimed at identifying the mathematical characteristics that generate this “chaotic” behavior.
In order to be able to speak of deterministic chaos it is necessary for the system to be described by deterministic equations, albeit not linear. It is also necessary that the numerical series used for the study be representative of a stationary state.
Unfortunately, the fact that the data captured are inevitably subject to noise has so far prevented the scale to tilt definitively in favor of a single theory.
 -0
-0  )
)
Leave a Reply